Timelines
DRAFT DOCUMENTATION
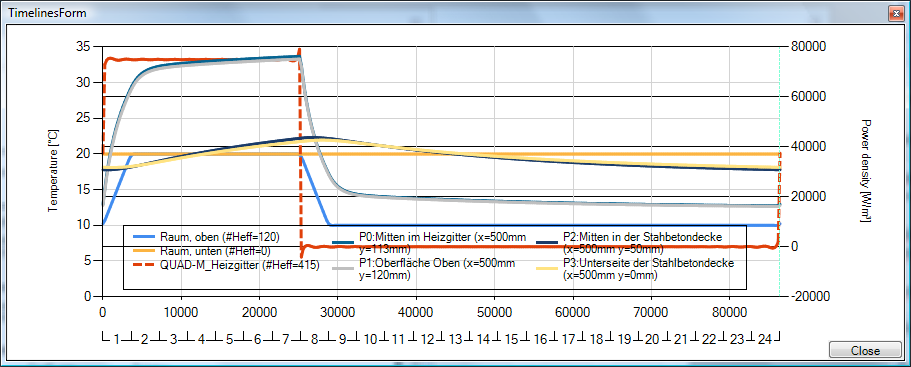
The Timelines window displays timelines of synthetic boundary conditions applied. The window is opened from the Boundary Conditions window.
| TRANSIENT-option: Solving and evaluating time dependant dynamic, periodic problems when heat capacity effects are concerned is only possible with an active TRANSIENT-Option of the program. |
 |
The creation of resulting chart involves of following work items:
Timelines of boundary conditions are created by harmonic Fourier synthesis based on
effective number of harmonics specified in the
Boundary Conditions window.
For power sources a second vertical axis on the right side of the chart is displayed; this axis and curves showing the
boundary conditions of power sources are display as dashed lines.
Remark: Values are (re)computed for each time value corresponding to respective pixel or pixel pair position along the time axis. When the window is resized by increasing its width significantly (more then doubled) then the calculation is restarted.
| MULTICORE-option: Speeding up computationally intensive jobs by distributing them on multiple processors or processor cores for parallel execution is only possible with an active MULTICORE-Option of the program. |
 |
The legend provides the identification of patterns shown. A double click on to the legend will change its position relative to the chart area (right, left, top, bottom).
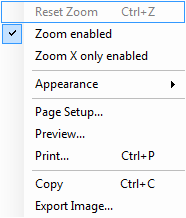 Context menu of the Chart
|
See also: